This was published by mistake and is unfinished. Please ignore
The following graph shows the daily new cases of COVID-19 in Ontario by date (horizontal axis). The numbers on the axis correspond to dates going from December 31 to November 23, left to right. The vertical axis are the numbers of new cases for each day. The orange box is the lockdown period, starting December 25 midnight to December 31.

Some comments on the data. New cases on the 25th numbered 2159 and the 7-day average was 2287. Case numbers peaked on the 24th and decreased into the lockdown period to the 28th when they reached a local minimum of 1939. At this point, both curves of case numbers and the 7-day average had reversed their rate of decline. After this the case numbers spiked upwards. The red 7-day moving average is a way to smooth out the ‘noise’ of daily number variations to indicate the trend. The trend was going down into the lockdown.
Incubation Period (latency)
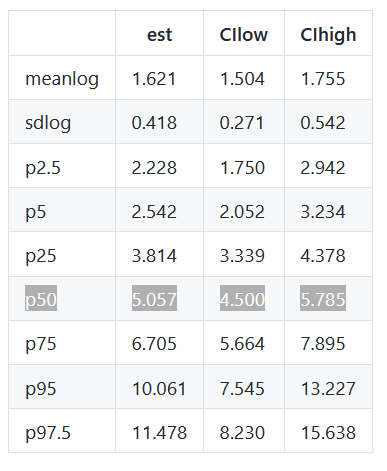
Now consider the scientific study by Lauer et al (2020)[1]. The SARS-Cov-2 virus has a median latency or incubation period of 5.1 days. This is the time between exposure or infection, and symptom onset. This is a median value meaning that half the cases studied developed symptoms on or before this time and the other half developed symptoms on or after this time up to 11.5 days, a period that contains 97.6 of all of the 185 cases studied. The data appears as:

Interpreting this graph, about 80% of all cases have appeared through day 7 and about 75% during the 5 days from day 3 through day 7. In this study and for our purposes, cases are identified by a positive diagnostic test at onset of symptoms. Actual data is in Figure 3.
The study was based on 185 subjects which gives a good statistical accuracy to the graph data.
Case Profile
We will assume that in Ontario, a case is recorded at symptom onset. The official definition of a case has an element of ambiguity which we have discussed elsewhere (The Case of Cases) and will disregard as being a small number compared to the total cases in a day.
First we will build a profile of the cases identified in one day. In some day n, the number of new cases, An, is the aggregate of the number of cases contributed by infections that began on previous days but did not manifest as symptoms until day n. From Figures 2 and 3, we infer that by day n-12, ~98% of all infections have been counted.
Let us denote the cases contributed to An from the day before, n-1, as Cn-1. Similarly, on day n-2, the contribution to An is Cn-2 which represents-less than 2% of infections that have manifested symptoms. The case contribution profile can then be written as the sum: An = ∑Cn-2 to Cn-12 since C0 = C1 = 0.
This case profile follows the log-normal distribution represented in Figure 2 and by the data in Figure 3. The confidence intervals will be considerably tighter since Ontario case count at this time are ≥ 2000.
Discussion
We will make a number of assumptions which we will remove later. The first assumption is that the daily case count is constant over the period (n,n-12) based on the 7-day moving average. This
Now let us assume that the lockdown works perfectly and no one is infected after the 25th or day n. Let us assume that every new case is discovered at symptom onset, something that should be true for the majority. It is important to understand that of the total new cases in a day, the largest number were infected 5 days before but smaller numbers were infected 4 and 6 days before, and so on. The numbers of different onset days discussed in the cited study was 11.5 or 12 days rounded.
Now consider the 26th or day n+1. We are still counting cases that were exposed 5 days befor and shorter periods but what happens is that the few cases that have the shortest onset period aren’t happening and don’t get counted. As a result, we would expect to see the daily new count and the 7-day average start to turn down. After day 5 we would expect to see an accelerating drop because there will no longer be any 5-day onset candidates which provide the largest case numbers.
The data is consistent with an increase in infections beginning on the 26th. If the trend was down going into the 26th and it is only on day three when cases begin to emerge, the result would be consistent with an increase beginning to affect case numbers on the 28th.
Other Studies
The ineffectiveness of the lockdown in slowing the virus spread is supported by a new peer-reviewed study out of Stanford University by Bendavid et al (2021)[5].
The authors noted that while non-pharmaceutical interventions (NPIs) had a positive effect on reducing case numbers (e.g. hand washing and social distancing), more restrictive NPIs (mrNPIs) – lock-downs – had a negative effect in some countries that used them such as France. This is the case with Ontario. Their conclusion was (emphasis added):
While small benefits cannot be excluded, we do not find significant benefits on case growth of more restrictive NPIs. Similar reductions in case growth may be achievable with less restrictive interventions.
Bendavid et al (2021)[5].
A large British Study[5][6][7] has been testing from 120,000 to 180,000 subjects in monthly rounds. Round 7a was 13th November to 24th November, round 7b was 25th November to 3rd December 2020, and round 8a was 6th January 2021 to 15th January 2021. A national lockdown began 4th January, 2021.
Over the 10 days of the completed round of testing [8a], out of 142,909 swab results, 1,962 were positive, giving a weighted prevalence of 1.58% (95% CI, 1.49%, 1.68%) or 158 people per 10,000 infected. This is the highest prevalence recorded by REACT-1 since it started in May 2020 and represents a greater than 50% increase from 0.91% in round 7b …
Source: UK Government[6]
Over this round (8a), they found “no strong evidence for either growth or decay averaged across the period“[5] but noted that “prevalence may have started to rise at the end of round 8a“[5].
If we look at Table 1 in the 8a final report of Riley et al (2021b)[7], we see that disease prevalence was falling from 1.32% in round 6b to 0.91% in round 7b. Unfortunately, the data gap between 7b and 8a doesn’t tell us what tje prevalence trend was into the lockdown.That the trend was steady to trending upmeans that the lockdown was ineffective and may have contributed to increased infection.
Conclusion
Analysis of Ontario’s case data shows that an increase in daily infections correlates to the start of the lockdown period. Causation is not implied but comments by Briggs[2] suggest a causative mechanism.
References
- Lauer SA, Grantz KH, Bi Q, et al. The Incubation Period of Coronavirus Disease 2019 (COVID-19) From Publicly Reported Con firmed Cases: Estimation and Application. Annals of I.M. May 5, 2020; https://doi.org/10.7326/M20-0504.
- Briggs WM. Why Lockdowns Spread Bugs Faster Than Liberty: Coronavirus Update XLVI. William M. Briggs. December 29, 2020.
- Real-time estimation of the novel coronavirus incubation time. GitHub. March 2, 2020.
- Bendavid E, Oh C, Bhattacharya J, et al. Assessing Mandatory Stay‐at‐Home and Business Closure Effects on the Spread of COVID‐19. ESCI. January 05, 2021. https://doi.org/10.1111/eci.13484.
- Riley S, Wang H, Eales O, et al (2021a). REACT-1 round 8 interim report: SARS-CoV-2 prevalence during the initial stages of the third national lockdown in England. January 21, 2021. http://hdl.handle.net/10044/1/85583. REACT1_r8a_final.pdf.
- REACT-1: real-time assessment of community transmission of coronavirus (COVID-19) in January 2021. UK Gov. January 21, 2021.
- Riley S, Wang H, Eales O, et al (2021b). REACT-1 round 8 final report: SARS-CoV-2 prevalence during the initial stages of the third national lockdown in England. January 21, 2021. REACT1_r8a_final.pdf.
0 Comments