Researchers worldwide, have been trying to develop mathematical models of the climate in order to predict future climate trends. These predictions are in turn used by bureaucrats and politicians to develop climate policy.
In order to facilitate the comparison of the performance of various models, a common infrastructure for collecting, organizing, and distributing output from models performing common sets of experiments has been created. Called the Coupled Model Intercomparison Project or CMIP, it is currently in its sixth version or phase, CMIP6.
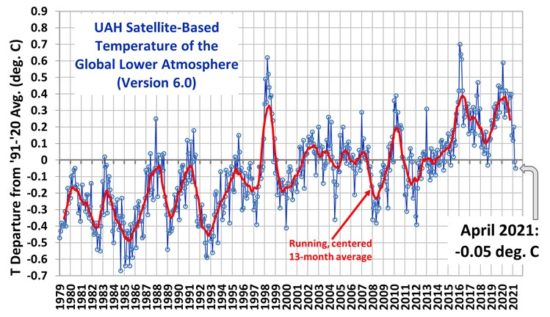
When models are run and compared to measured satellite temperature data which is the most accurate, almost all models exceed the observed data by as much as a degree. Dr. Roy Spencer is principal research scientist at the University of Alabama in Huntsville and publishes the satellite data shown in Figure 1. Because monthly data is so variable or ‘noisy’, a 13-month running average is used (red line) to indicate temperature trend.
He recently ran 68 simulations from 13 models using CMIP6 parameters and data. For the results shown in Figure 2, all except one ran hotter than the observed satellite data (the solid black line).

Dr. John R. Christy who works with Roy Spencer, has run 40 models with the current CMIP6 parameters, shown in Figure 3. The red arrow points to the Canadian model.

The Canadian Model
CanESM5 is a climate model developed in Canada[1][6]. As the developers state, the
Canadian Earth System Model version 5 (CanESM5) is a global model developed to simulate historical climate change and variability, to make centennial-scale projections of future climate, and to produce initialized seasonal and decadal predictions.
Swart et al (2019)[1]
CO2 is a dominant parameter in their model. Its sensitivity to CO2 is higher than any other of 40 models tested with CMIP6 parameters – see Figure 4.

Figure 4. Equilibrium Climate Sensitivity (ECS) to CO2 forcing in 40 climate models under CMIP6. Source: CarbonBrief[3].
An Australian Study[2] found that of 24 models compared using CMIP6, the Canadian model, CanESM5, had the highest global mean additive error as shown in Figure 5.

When temperature predictions are compared under CMIP6, the Canadian model is found to run hottest – see Figures 3, 6,and 7.

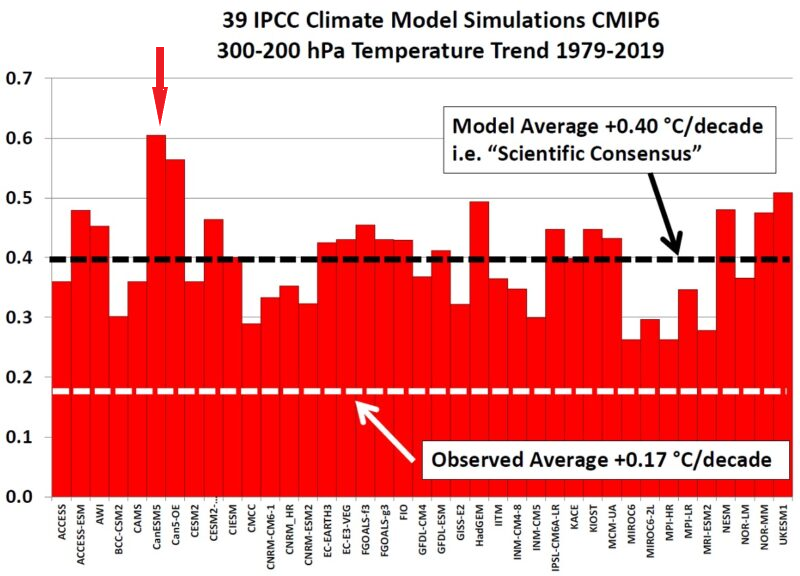
Figure 7. Canadian model, red arrow, running hottest. Source: Clintel. New presentation by John R. Christy:
One final area where CanESM5 is an outlier is in estimates of precipitation over the Indo-Pacific (MC) region. The actual observations are measured by the Tropical Rainfall Measuring Mission 3B42 Version 7 (TRMM). The performances of the CMIP6 models are arranged about the TRMM value as mean and plotted, in Figure 8, to show their deviation from the observed (mean) value. In this case, CanESM5 is second lowest – farthest deviation from actual values – in each of CMIP5 (blue arrow) and CMIP6 (red arrow) runs.

In conclusion, the Canadian climate model, CanESM5, is the most extreme of all current models and forecasts the highest temperature anomalies. This make it the most inaccurate of available models but an excellent tool for creating policy around the climate catastrophe meme.
References
- Swart NC, Cole JNS, Kharin VV, et al. The Canadian Earth System Model version 5 (CanESM5.0.3). Geosci. Model Dev., 12, 4823–4873, 2019. https://doi.org/10.5194/gmd-12-4823-2019.
- Stone A. Research brief: Decomposing temperature extremes errors in CMIP5 and CMIP6 models. ARC CLEx. July 24, 2020.
- Hausfather Z. CMIP6: the next generation of climate models explained. CarbonBrief. December 02, 2019.
- Eyring V, Flato G, Lamarque J-F, et al. Status of the Coupled Model Intercomparison Project Phase 6 (CMIP6) and Goals of the Workshop. WCRP. March 25, 2019. PDF.
- Ahn M-S, Kim D, Kang D, et al. MJO Propagation Across the Maritime Continent: Are CMIP6 Models Better Than CMIP5 Models? AGU. May10, 2020. https://doi.org/10.1029/2020GL087250.
- McKitrick R and Christy J. A Test of the Tropical 200‐ to 300‐hPa Warming Rate in Climate Models. AGU. July 06, 2018. https://doi.org/10.1029/2018EA000401.
0 Comments