There is a surprise ending to this story.
The Personal Carbon Footprint
Your carbon footprint (CF) is an artificial calculation to try and approximate the annual contribution of CO2 emissions that you contribute to the world. As might be expected, this is a complex calculation, different for every person and every location. There are online calculators that you can use to calculate your own CF. It is unlikely that any two will agree exactly. Further, your CF will be different than your partner’s and possibly quite different from your neighbour’s.
We need to be able to calculate average CFs for different dimensions in order to develop policies for manipulating CO2 emissions. Presumably large scale studies have been done to arrive at averages, particularly for individual countries. Since I am concerned about Canada, I found two sources that gave averages.
The first source is a CBC article, Canadians are among the world’s worst carbon emitters. Here’s what we can do about it. Now the CBC is Canada’s official government mouthpiece for disseminating propaganda and moulding public perception. In the article we find that the Canadian average is 14.2 tons/year. Here is the chart that they use to show how bad we are in Canada.
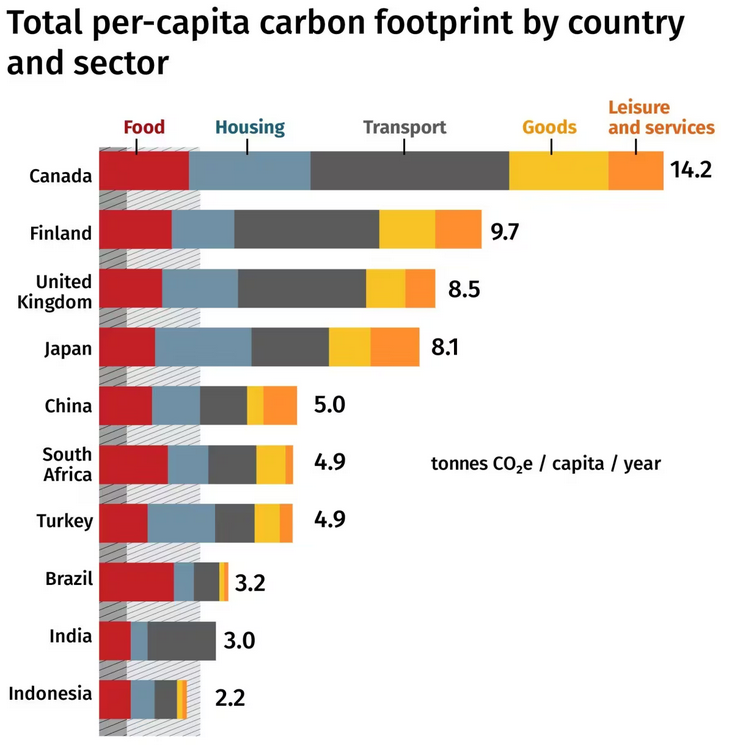
Source CBC and other.
This is what is known as “cherry picking” data or selecting data that suits your agenda. Absent from this list are the G7 countries: USA, Germany, France, and Italy. Further, we might want to see other European countries such as Spain, Portugal, Netherlands, Norway and Sweden.
The second source for an average CF is UCAR (University Corporation for Atmospheric Research). In What’s Your Carbon Footprint?, they state that “each person produces about 16 tons of carbon dioxide each year“. This is close to the CBC number which we will go with.
Immigration in Canada
This early in 2024, final numbers may not be available in which case estimates will be used. Overall population size between censuses are always an estimate. Even the census may be an extrapolation of a limited data set. The current population estimates for 2023 from Statistics Canada are4:

We see that the population increased by 1,252,256 (est.).
Here are Canada’s immigration targets for 2024-20261:
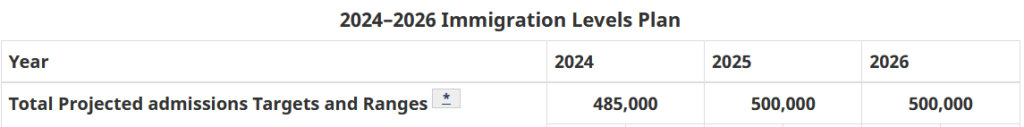
For 2023, the target is 465,0002. The estimate is that the final number may reach 500,0002. Statistics Canada notes third quarter immigration levels which on a linear extrapolation would mean 495,000 for the year5.
Canada welcomed 107,972 immigrants in the third quarter. From January to September 2023, immigration reached 79.8% (371,299) of Immigration, Refugees and Citizenship Canada’s target of 465,000 immigrants for the year.
Statistics Canada5.
CO2 Emissions in Canada
According to the National Observer, Canada’s emissions in 2019 measured in megatons (MT) were:
… Canada’s total emissions in 2019 were 730 MT, meaning those 71 sites spewing 162 MT of greenhouse gases into the atmosphere were responsible for over 20 per cent of the country’s total.
Source: National Observer.
From an interactive graph that they publish, the worst single source of emissions is Syncrude Canada at 12.254 MT. In 4th place is Keephills Thermal Electric at 7,644 MT. In fact the top 9 places are all oil sands projects or thermal power plants.
For fun, take an immigration level of 495,000 and an average CF of 14.2 MT. This means that the Federal Government through their immigration policy is generating about 7 MT of CO2. Moreover, this generation accumulates year by year. Assuming industry is acting responsibly by either maintaining or reducing CO2 production levels, The government, in 2023, became the 5th “dirtiest” producer of CO2 emissions and with their planned immigration levels, should be the worst producer (500 x 4) by the end of 2026.
References
- 2023 Annual Report to Parliament on Immigration. Government of Canada.
- Canada Welcomes Record Number of New Residents in 2023: Immigration Targets May be Exceeded. +1News. August 13, 2023.
- Refugee Statistics in Canada Made in Canada. January 9, 2024.
- Table 17-10-0009-01 Population estimates, quarterly. DOI: https://doi.org/10.25318/1710000901-eng.
- Canada’s population estimates, third quarter 2023. Statistics Canada.
***
If you liked this post, consider subscribing – in right-hand sidebar – if you are not a subscriber already. Please forward it to anyone else you might think will benefit from it. We are at a critical point in time where we need to disseminate truth to those who have ears to hear, and be forming communities of like-minded individuals. If you want to discuss an idea or issue, contact me – see Contacts.
0 Comments