Last updated by The POOG on May 09, 2021.
Global temperature is a surprisingly difficult concept to quantify by measurement. Traditional methods using thermometers have only been in use since the seventeenth century[1].
Historical Data
Significant temperature risks to our society are all related to global cooling. That mammoths have been found flash frozen with stomach material undigested suggests that extreme and rapid cooling events may be possible. In any case, another grand solar minimum (GSM) with reduced temperatures over a decade or several decades means reduced harvest with starvation and increasing disease. Indeed past such minima have correlated with the fall of empires (see Figure 1a). On the other hand, during warming periods, civilizations flourished.

Figure 3 of the Vostock ice core data in our article CO2 shows a cyclical pattern of glaciation lasting roughly 100,000 years. If the pattern continues then we are near the en of an inter-glacial warm period and should be expecting a relatively steep drop of temperature in geological time scale, of 10 degrees Kelvin (Celsius).
Determinations of solar minima are based on sunspot cycles. We are beginning solar cycle 25 having reached the bottom of the last cycle in 2019-2020. There is a wide range of estimation of the strength of cycle 25. The average estimate is that it will be about the same strength as cycle 24 before descending into the next GSM.
Proxy Data
Reliable direct measurement of temperature thorough instrumentation began in the mid-nineteenth century. Prior to that temperature data had to be inferred from what are called proxy data sets.
One of the factors that affect tree growth is temperature. The amount of annual growth can be measured by the width of “rings’ in a cross-section of a tree’s trunk. There are many other proxies that can be used such as ocean sediments.
As you might suspect, the results may have a large margin of error since other factors with any proxy, may be operating. But when different proxy data sets, especially quite independent ones, are correlated, the results become more accurate.
Roy Spencer has published Figure 1b shows “the average of 18 non-tree ring proxies of temperature from 12 locations around the Northern Hemisphere, published by Craig Loehle in 2007, and later revised in 2008“.
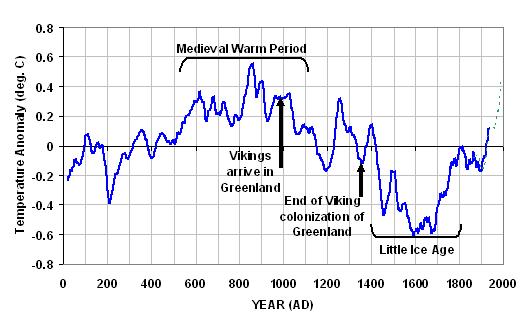
A critical reader might observe that this data only goes to about the time the paper was published in 2007. What about warming since then? Roy Spencer also publishes the satellite data in Figure 2. One can can use this data to set the recent (2015-2021) temperature anomaly maximum at about 0.4 degrees, still almost 0.2 degrees below the maximum of the medieval warming period.
Satellite Data
The original means of measuring temperature was the mercury thermometer. In 1979, the National Oceanic and Atmospheric Administration (NOAA) launched the first of a series of satellites to measure atmospheric temperature. Satellite data is a more accurate measure of global temperature because the satellites cover most of the globe. Thermometers are not arranged to give good geographic coverage and can’t give consistent ocean coverage.
Dr. Roy Spencer and his colleagues produce a monthly temperature figure, available at https://www.drroyspencer.com/latest-global-temperatures/. At the time of this writing in April, 2021, the most recent data is:
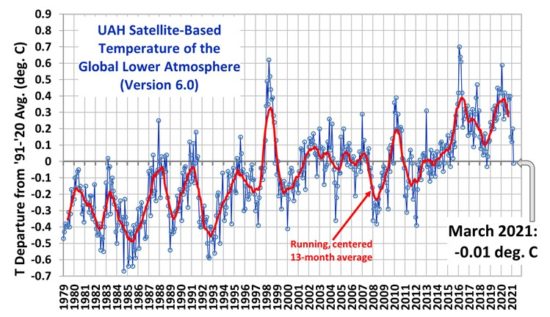
The graph shows the important distinction between weather data (blue) and climate data (red). Climate is the longer-term average of weather data, in this case a 13-year simple moving average.
Fudging the Data
Tony Heller explains how NOAA falsifies temperature records to warm them up.
An important observation which has been made by others in the past is that large areas of the globe have no thermometers for official data recording, while other vast areas have at most a handful. To get a “global” record one must make gross assumptions and manipulate the data extensively. Heller in the video, references the decline in the number of US thermometers and this is true globally. So why not use satellite measurements that do give a global data set?
So let’s go to the source of the land temperature data, NOAA:
Heller also has a three-part video series showing how NOAA fudges US Temperature data shown in Figures 5, 6 and 7a.
Here’s another article showing the intentional alteration of data by NASA to support the AGW mythology.
Non-climatic Bias
Temperature reporting frequently ignores or incorrectly accounts for thermal effects of urbanization. A recent study by Scafetta et al (2021)[3] found:
By merging the sea surface temperature record (assumed to be correct) and an adjusted land temperature record based on the model prediction, the global warming during the same period is found to be 15–25% lower than reported. The corrected warming is compatible with that shown by the satellite UAH MSU v6.0 low troposphere global temperature record since 1979.
Scafetta et al (2021)[3]
Sea Surface Temperature
NOAA measures and publishes global Sea Surface Temperature (SST) Contour Charts.
Cyclic Patterns
Here’s an interesting paper, Nature Unbound II: The Dansgaard- Oeschger Cycle, on what are called
Dansgaard-Oeschger cycles are primarily northern hemisphere temperature cycles of about 8 degrees C with a very regular period of 1470 years: Dansgaard-Oeschger (D-O) events. A second type of large temperature event is the 6,000 year period, Heinrich event. Of the D-O event, the author notes that “CO2 has no role during D-O cycle, and its levels are neither cause nor consequence of the most frequent and most abrupt climate changes of the past.” Since both of these events span temperature ranges much greater than the 2 degrees the climate alarmists are worried about, we may be throwing money at the wrong problem. Maybe we should be worried about the next ice age.
Another group of cycles that affect climate and temperature in particular are Milankovitch Cycles. These are explained in this video:
Links
References
- Mary Bellis. The History of the Thermometer. ThoughtCo., May 07, 2019.
- Javier. Nature Unbound II: The Dansgaard- Oeschger Cycle. Climate Etc. February 17, 2017.
- Scafetta N. Detection of non‐climatic biases in land surface temperature records by comparing climatic data and their model simulations. Clim Dyn. January 17, 2021. https://doi.org/10.1007/s00382-021-05626-x.